
Marketing teams are drowning in data. Every campaign leaves a trail of numbers, opens, clicks, impressions, followers, conversions. The temptation is to track it all, but that quickly leads to dashboards stuffed with vanity metrics. On the other end of the spectrum, some teams barely track anything, relying on instinct and gut feel. Both approaches fail for the same reason: they don’t reveal what’s really working.
With the right KPIs, you see how much it costs to win a customer, how long they stick around, and whether your automation actually drives revenue. Miss them, and automation risks becoming an expensive experiment.
In this article, you’ll learn:
- The essential KPIs for customer growth, engagement, and conversions
- How value metrics like ROI and revenue per lead prove automation’s impact
- The role of testing in refining campaigns and improving performance
- Tools that make KPI tracking seamless, and how Text® App helps unify the view
- Best practices for measuring and improving your automation results
Let’s examine it in detail and see how the right KPIs transform marketing automation from “busy work” into a measurable growth engine.
Understanding marketing automation KPIs
Marketing automation is designed to remove repetitive work and make campaigns more efficient. But efficiency on its own doesn’t guarantee impact. That’s where key performance indicators (KPIs) come in handy. KPIs are measurable values that reveal whether your marketing automation, including email campaigns, ads, and even SEO efforts, is driving meaningful results.
They help you move beyond surface-level numbers like “emails sent” or “ads published” and focus instead on outcomes that matter to your business. When tracked consistently, they allow you to gain valuable insights into how automation connects directly to growth.
Automation has a multiplying effect. A well-designed email journey can nurture thousands of prospects at once, but if the messaging misses the mark, thousands of impressions are wasted. Without key performance indicators, there’s no way to know which campaigns are contributing to growth and which are draining resources.
KPIs create accountability. They connect activity (what you’re doing) to performance (what it’s achieving).
KPIs as a bridge to business goals
Key performance indicators are most valuable when aligned. They link the daily actions inside marketing automation platforms, such as automated emails, triggered ads, and lead nurturing workflows, to broader business objectives like revenue growth, customer loyalty, and lower acquisition costs.
When the right KPIs are in place, marketers can prove how automation contributes to long-term profitability, not just short-term engagement.
Think of marketing automation KPIs as the compass that keeps marketing teams on course:
- Instead of chasing vanity metrics, you’re tracking performance against strategic goals.
- Instead of relying on instinct, you’re making data-backed decisions.
- Instead of reporting activity, you’re showing business impact.
Here are three core digital marketing KPIs that demonstrate the connection between automation and business growth:
Customer acquisition cost (CAC)
How much do you spend to acquire one customer? Automation should help reduce CAC by making lead nurturing more efficient and by improving the handoff to sales. A rising customer acquisition cost is a red flag that automation isn’t optimized.
Marketing qualified leads (MQLs)
Not every lead is worth a salesperson’s time. MQLs are leads that have interacted enough with your content, downloads, webinar sign-ups, and email clicks that they’re considered ready for sales outreach. Tracking MQLs shows whether your automated marketing campaigns are attracting the right audience and preparing them for conversion.
Sales qualified leads (SQLs)
SQLs go one step further. These are leads that the sales team has reviewed and deemed ready for direct contact, whether that means scheduling a demo or discussing a proposal. Measuring how many MQLs successfully progress to SQLs shows how well automation is aligning marketing with the sales process and generating leads that are truly sales-ready.
Customer lifetime value (CLV)
Acquiring a customer is only the beginning. CLV measures the total revenue a customer brings in over their relationship with your business. Automation plays a big role in increasing CLV by keeping customers engaged, encouraging repeat purchases, and strengthening loyalty.
Together, these marketing automation KPIs provide a balanced view: CAC shows how cost-effective your automation is, MQLs highlight lead quality, and CLV measures long-term value.
Customer metrics in marketing automation KPIs
When automation is used to scale marketing, understanding how it impacts customer economics, and not just activity, is essential.
These metrics tell the story of whether your automation is driving efficiency, value, and loyalty.
Here’s a deeper dive, with real-world examples and benchmarks to bring the numbers to life.
Customer acquisition cost (CAC) and measuring efficiency
This metric shows whether your automation is making new customer acquisition more affordable or more expensive. If CAC is trending upward, it’s a warning that your marketing campaigns may be targeting the wrong audience or that personalization isn’t hitting the mark.
In practice, reviewing lead scoring, refining audience segments, or adjusting campaign timing often helps bring CAC back under control. For example, companies that use behavioral triggers in email automation often see CAC drop because they’re focusing resources on leads with higher intent.
Benchmarks vary by industry: For example, ecommerce sees an average CAC of around $70, while B2B SaaS sits much higher at approximately $702, and fintech tops the list near $1,450.
Put in context, a company spending $1,000 on digital marketing and sales that brings in 10 customers results in a CAC of $100, a useful baseline for evaluation.
Customer lifetime value reveals long-term value
CLV puts a price tag on customer relationships. A high CLV justifies bigger investments in acquisition, while a low CLV suggests your strategy isn’t nurturing long-term loyalty. Automation can lift CLV through personalized product recommendations, timely upsell marketing campaigns, or loyalty program reminders.
For instance, an ecommerce brand might increase CLV by automating “back-in-stock” alerts or offering repeat-purchase discounts, keeping customers engaged beyond the first transaction.
A healthy CLV: CAC ratio generally falls between 3:1 and 5:1, indicating strong long-term profitability. For instance, a CLV of $3,000 paired with a CAC of $750 yields a ratio of 4:1, a sign of sustainable growth.
Customer retention rate means loyalty and churn in focus
Retention is the basis of profitability. A high CRR signals strong loyalty, while a declining rate highlights churn risks. Marketing automation can directly improve CRR by sending post-purchase care tips, renewal reminders, or “win-back” marketing campaigns when customers go inactive.
Businesses that invest in automated re-engagement emails often see measurable lifts in CRR, as they catch new customers before they drift away.
While exact retention benchmarks vary, the most successful B2B SaaS firms aim for 90% to 95% customer retention annually.
Retention is critical because it complements CLV, keeping customers longer directly boosts lifetime value, making acquisition efforts more valuable over time.
How they work together
Consider this scenario: A mid-sized SaaS company reports a CAC of $800, a CLV of $3,200, and retention rates holding above 90%. Their CLV: CAC ratio is 4:1, placing them squarely in the “efficient and scalable” range. Strong retention further signals that the customer relationships cultivated through automation are valuable and enduring.
Tracking these metrics together lets you:
- Lower CAC by testing and optimizing automated workflows and targeting.
- Boost CLV through post-purchase nurturing, upsells, and personalization.
- Improve CRR by re-engaging customers before churn and maintaining value-driven communication.
Customer metrics are direct signals about the health of your online marketing automation. Interpreting them correctly turns raw data into action. CRMs make this process even more effective by centralizing customer data and interaction history, allowing teams to connect these KPIs with individual customer journeys. This unified view makes it easier to spot patterns, identify bottlenecks, and act quickly on insights.
When tracked together and supported by customer relationship management systems insights, CAC, CLV, and CRR shift marketing automation from being a reporting tool to a strategy compass. They give you the context to decide whether to double down on acquisition, focus on retention, or rework nurturing flows. Most importantly, they tie everyday campaign activity to revenue, making growth not just faster but smarter.
Engagement metrics
Engagement metrics reveal how much attention your audience gives to your marketing. While acquisition and revenue numbers show business outcomes, engagement KPIs tell you whether people are actually connecting with your campaigns day to day.
They uncover what sparks curiosity, what gets ignored, and what drives deeper involvement.
Email engagement
Email remains a foundation of marketing automation, and the right marketing automation KPIs show how well those automated sequences are working:
- Open rate: Measures the percentage of recipients who open your emails. According to industry benchmarks, average open rates hover around 34% across all industries. A strong open rate signals that subject lines are relevant and your timing is right. If rates are falling, it may be time to A/B test subject lines or adjust sending frequency.
- Click-through rate (CTR): Indicates how many readers clicked on a link inside the email. CTRs typically average 2–5%, but targeted, personalized campaigns often perform higher. Low CTRs suggest that while subject lines attract attention, the message inside isn’t motivating action.
- Inbox hit rate: Tells you how many emails actually land in the inbox instead of the spam folder. High deliverability (95% or more) is critical; if digital marketing campaigns don’t reach the inbox, engagement can’t happen.
- Unsubscribe rate: When more than 0.5% of recipients unsubscribe from a campaign, it’s often a red flag that content is misaligned or your automation cadence is too aggressive.
Together, these email KPIs give you a detailed picture: high opens but low clicks mean your hooks are strong but content falls flat, while a rising unsubscribe rate warns of campaign fatigue.
Website engagement
Your website is often the hub where automated marketing campaigns send visitors. Tracking behavior here reveals whether people are exploring further or leaving immediately.
- Bounce rate: The percentage of visitors who leave after one page. A rate above 60% usually indicates a disconnect between the promise of your ad or email and the landing page experience.
- Multi-page session rate: A more positive measure, showing the percentage of visitors who explore multiple pages. High rates suggest strong interest and alignment between expectations and site content.
Social media interaction and engagement
On social channels, engagement metrics, likes, shares, comments, and clicks go beyond vanity numbers. These social media marketing efforts indicate whether your brand is building community and sparking conversation. For automation, social engagement feeds retargeting audiences and strengthens the reach of other campaigns, making it a key signal of brand resonance.
Engagement and traffic metrics don’t just measure attention; they measure relevance. If people open, click, browse, share, and stay subscribed, your automation is delivering the right message at the right time. If they bounce, unsubscribe, or ignore, it’s a signal to revisit content, targeting, or frequency.
In short, engagement KPIs tell you the truth about one essential question: Does your audience actually care?
Conversion metrics
If engagement metrics show you who’s paying attention, conversion metrics reveal who’s taking action. They track the moments when curiosity becomes commitment, whether that means signing up, requesting a demo, or making a purchase.
These marketing automation KPIs are essential for proving that your automation is driving not just clicks, but revenue.
Landing page conversion rates
Landing pages are often the final step in an automated journey. Conversion rate measures the percentage of visitors who complete the desired action on the page.
According to Unbounce, the average conversion rate there across industries is about 4.3%, though high-performing pages in sectors like SaaS, finance, and ecommerce can achieve 10–15%. A poor conversion rate usually signals a gap: the ad or email driving traffic might not align with the page, forms may be too long, or the CTA isn’t compelling enough.
A SaaS company trimmed its demo request form from 10 fields to 4, improving landing page conversions from 3% to nearly 7%. The lesson is that simplifying the user’s path often pays off.
Lead progression: contacts → prospects → customers
Marketing automation should guide people naturally from awareness to decision. Tracking progression across funnel stages reveals whether your workflows are doing that job.
- Contacts: raw leads entering through forms, sign-ups, or downloads.
- Prospects: engaged leads who show intent, like attending a webinar or engaging with multiple emails.
- Customers: prospects who convert into paying accounts.
If many contacts stall before becoming prospects, it’s a sign that nurturing sequences need work. If prospects don’t progress to customers, sales enablement or handoff processes may be the weak link.
Follow-up conversion rates
Few buyers convert on the first interaction. That’s why follow-up is crucial, and automation often sets the stage for sales-assisted outreach.
A B2B company found that only 15% of inbound demo requests closed immediately. But when paired with structured sales follow-ups, like personalized sequences triggered by automation, an additional 20% converted within 30 days.
Tracking this metric highlights the synergy between automated nurturing and human touch.
CAC and CRR as crossover metrics
Some conversion numbers don’t live in isolation. CAC and CRR are often thought of as customer metrics, but they’re also indicators of conversion quality.
- If CAC is climbing while conversion rates stagnate, it means campaigns are becoming more expensive without yielding proportionate returns.
- If CRR is low, it may indicate that conversions aren’t sustainable, that new customers attracted through automation aren’t staying loyal.
In other words, it’s not enough to convert leads. You need to convert the right leads.
Conversion KPIs connect the dots between interest and revenue. High open rates and clicks mean little if people don’t move deeper into the marketing funnel. Tracking pages' performance, funnel progression, follow-up marketing success, and crossover indicators like CAC and CRR, lets marketers see where automation is driving growth and where it’s leaking opportunities.
These metrics ensure you’re not just building campaigns that attract attention, but campaigns that deliver business outcomes.
Value metrics
The ultimate test of marketing automation tools is financial impact. Generating leads or improving click-through rates is not enough if those actions don’t translate into revenue.
Value metrics go beyond surface-level activity and show whether automation is truly driving growth.
Return on investment (ROI)
ROI is often considered the north star of digital marketing automation because it captures the big picture: how much money campaigns are generating compared to what they cost to run. When ROI is positive, automation is doing more than saving time; it’s delivering measurable profit. When it dips, it’s a signal to reevaluate campaigns or reallocate spend.
For example, if a company spends $10,000 on automation tools and paid campaigns and earns $30,000 in revenue directly tied to those efforts, the ROI is 200%.
That’s a clear indicator that automation is efficient and profitable. Executives want to see this figure when they decide whether to scale automation further.
Revenue per lead (RPL)
While ROI shows overall effectiveness, revenue per lead tells a more focused story about lead quality. It answers the question: how much revenue does each new lead actually bring in? A higher RPL means campaigns are attracting the right kind of audience, people who don’t just click, but also buy.
Consider a B2B SaaS company that runs two automated campaigns: one driving sign-ups from social ads, and another from webinars. On paper, both campaigns generate similar numbers of leads. But when revenue is divided by leads, it turns out webinar leads are worth three times more.
RPL exposes this difference and gives marketers the clarity to double down on the campaigns that bring in the most valuable customers.
Repeat customer revenue and total revenue generated
A single purchase is a start, but sustainable growth comes from customers who return again and again. That’s why repeat customer revenue is such a critical metric. It shows whether automation is building relationships strong enough to turn first-time buyers into long-term advocates.
In many industries, returning customers generate the bulk of revenue; ecommerce studies suggest they can account for as much as 40% of sales even when they represent a smaller share of the customer base.
Alongside repeat customer revenue, tracking the total revenue generated by automated campaigns ties everything together. It prevents marketing from being evaluated in isolation and ensures the numbers connect directly to business outcomes. When you can point to total revenue influenced by automation, you’re no longer talking about clicks and opens; you’re talking about growth.
Why value metrics are important
Value metrics bring focus to what counts. ROI shows whether the whole automation strategy is financially viable. RPL drills down into the quality of leads. Repeat revenue proves the staying power of customer relationships. Together, they ensure automation is more than a set of workflows; it becomes a revenue engine.
When these revenue metrics trend in the right direction, it’s evidence that automation isn’t just capturing attention; it’s creating measurable business impact.
Tools for measuring KPIs
Tracking KPIs isn’t just about knowing which numbers to watch; it’s about having the right tools to capture them accurately. From website analytics to campaign dashboards, SEO tracking, and intent data, each tool plays a role in turning raw activity into meaningful insight.
Here’s a quick comparison of the most useful options:
| Tool | What it measures | Importance |
|---|---|---|
| Text App | Unified analytics across live chat, email, and AI-driven conversations; customer interaction history; performance reporting. | Gives marketers a single view of campaign results, customer engagement, and organic traffic trends. AI-driven reporting highlights which campaigns convert best, helping teams optimize with confidence. |
| Marketing automation platforms (e.g., Klaviyo, HubSpot, Marketo) | Email opens, CTRs, campaign conversion rates, and multi-channel performance. | Provide direct visibility into campaign effectiveness across a marketing program and facilitate the comparison of different workflows or journeys. |
| B2B data platforms (e.g., ZoomInfo) | Buyer intent, firmographic data, and lead quality insights. | Reveal which leads are most likely to convert, improving targeting and reducing wasted spend. |
| Google Analytics | Website traffic, organic traffic, conversion funnels, bounce rates (including visitors who leave after viewing only one page), and drop-off points. | Helps marketers see how automated campaigns and SEO efforts drive site visits, measure performance on search engine results pages, and identify where prospects lose interest in the funnel. |
Each of these tools shines in its own way. Google Analytics explains what’s happening on your site and how organic search is driving visitors, automation platforms measure campaign performance across your marketing program, B2B data tools sharpen targeting, and Text App pulls everything together into one clear view.
Used in combination, they give marketers both the big picture and the fine detail needed to fine-tune strategy.
Tips for better marketing automation KPI tracking:
- Define the goal first. Choose tools and key metrics that map directly to business objectives.
- Avoid siloed data. Connect analytics across platforms so you’re not measuring in isolation.
- Automate reporting. Save time by setting up scheduled reports that surface the digital marketing KPIs you care about most.
- Review regularly. KPIs aren’t set-and-forget; adjust campaigns as numbers shift.
- Balance depth with clarity. It’s better to track fewer, high-impact KPIs consistently than dozens of shallow ones.
Testing and optimization
Even the most carefully designed digital marketing automation campaign is built on assumptions.
You might believe a certain subject line will grab attention, or that a landing page layout is persuasive, but until you test it, you’re guessing. A/B testing removes that uncertainty by comparing two versions of the same element and showing, through data, which one performs better.
A/B testing is critical in marketing automation efforts because it translates creative choices into measurable outcomes. It allows you to refine campaigns continuously instead of launching them and hoping for the best.
Even small changes can have outsized effects: a slightly reworded subject line might boost open rates by 10%, while a different image on a landing page could increase conversions by 20%. When you multiply these incremental improvements across dozens of campaigns, the revenue impact becomes significant.
The scope of A/B testing goes well beyond subject lines. Marketers can test almost every component of an automated journey:
- Subject lines and preview text in email campaigns to improve open rates.
- Call-to-action (CTA) buttons, from color and placement to wording, influence click-throughs.
- Landing page layouts, including headlines, form length, images, and testimonials, are used to see what drives more completions.
- Send times and frequencies can drastically change engagement. Sometimes, sending at 7 AM instead of 10 AM doubles the open rate.
- Personalization strategies include using a customer’s name in subject lines or tailoring product recommendations based on behavior.
If you test systematically, you can uncover what resonates most with your audience instead of relying on broad best practices.
How KPIs guide the process
For A/B testing to work, it must be tied directly to marketing automation KPIs. If you’re testing subject lines, the winning version should be determined by open rates and inbox hit rates. If you’re testing landing pages, conversions, and bounce rates matter most. For lead nurturing workflows, follow-up conversion rates and eventual customer lifetime value (CLV) can highlight which path produces stronger long-term results.
This KPI-driven approach ensures that testing aligns with business goals rather than surface-level changes. It also prevents “false wins,” where a variation looks better on paper but doesn’t actually impact revenue.
Continuous testing for long-term ROI
One-off tests are helpful, but the real advantage comes from building a habit of continuous optimization. Audiences change, platforms evolve, and what worked last quarter may underperform today. By making A/B testing a recurring part of your marketing automation strategy, you create a feedback loop: test → learn → refine → repeat.
For example, an ecommerce brand running automated cart abandonment emails might start by testing subject lines. Once they find a winner, they can move on to testing product images, CTA buttons, or discounts offered. Over time, this iterative approach can double or even triple conversion rates without increasing ad spend.
Continuous testing sharpens campaigns and protects ROI. It ensures that automation budgets are used effectively and that improvements compound over time, turning marketing automation efforts into a true engine of growth.
How Text App helps turn KPIs into action
Tracking digital marketing KPIs is one thing. Acting on them is another. Many marketers face the same challenge: their data lives in silos. Email reports are in one tool, website metrics in another, and client interaction data spread across chat and helpdesk systems. This fragmentation makes it hard to connect the dots between CAC, CLV, engagement, and conversion.
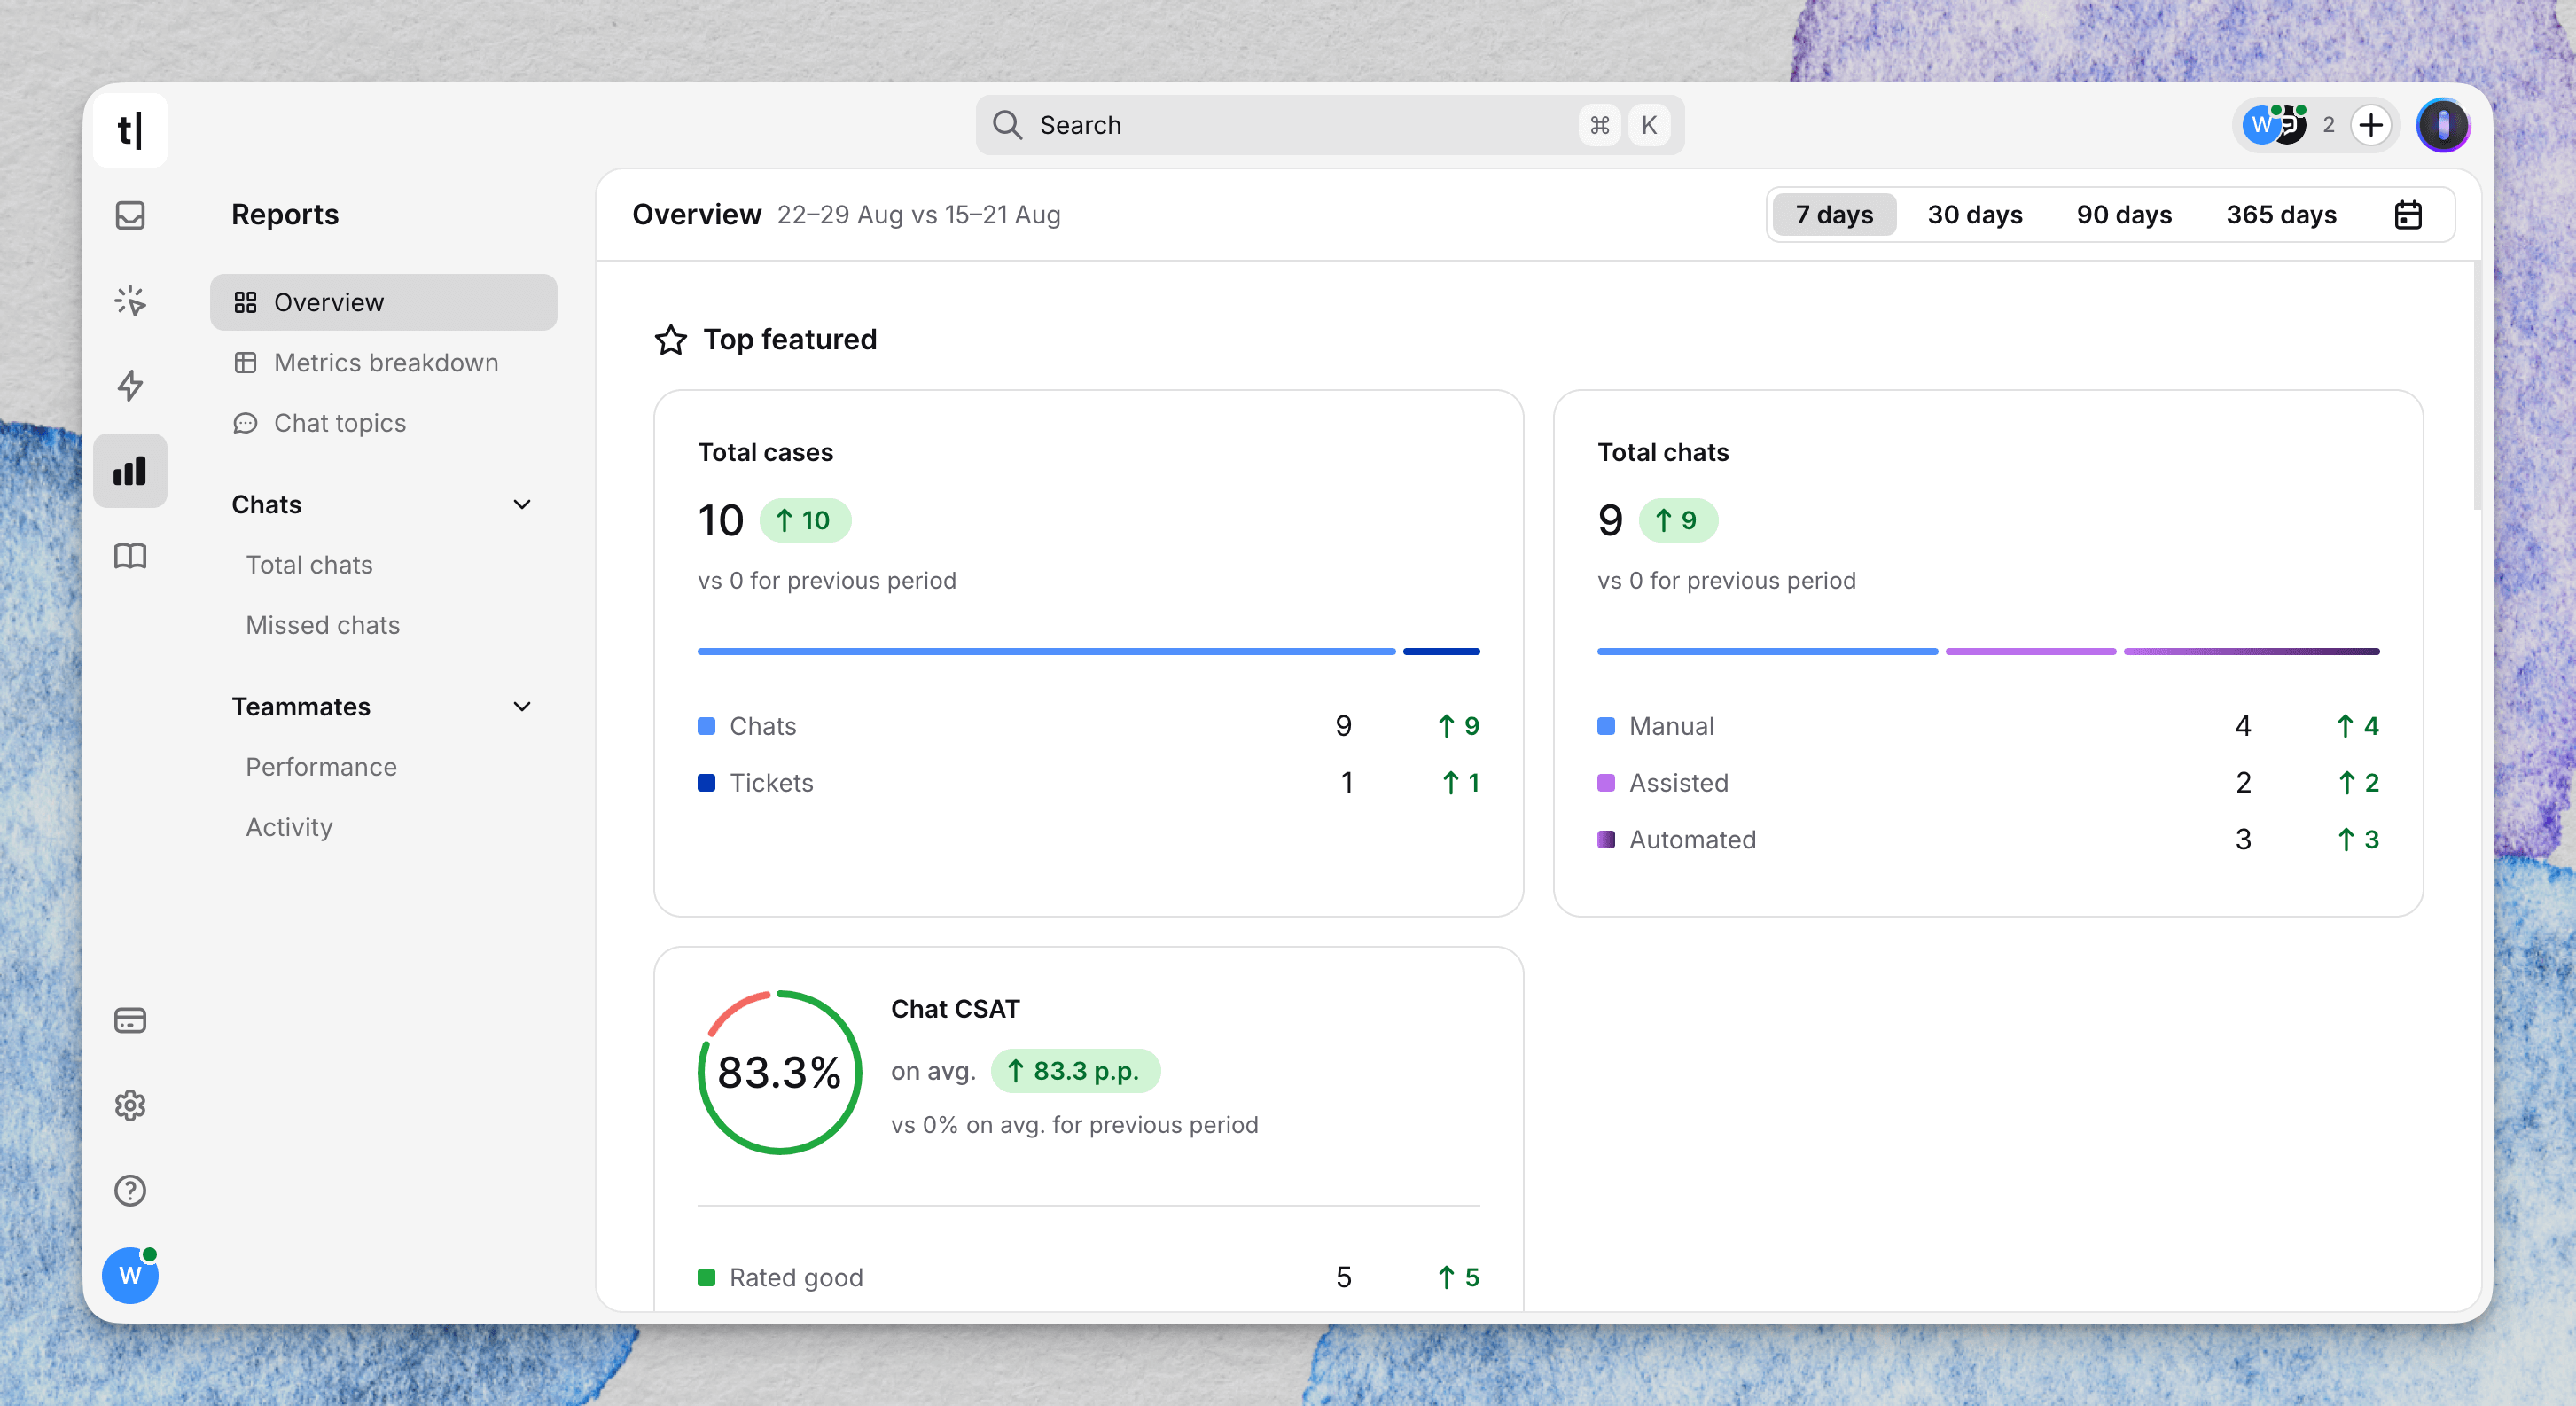
Text App solves this by unifying analytics in a single workspace. Instead of switching between multiple dashboards, teams see live chat data, email performance, and AI-driven conversation reports all in one place. That means you can measure the entire customer journey, from the first click to repeat purchase, without losing context.
Where Text App stands out is its AI-powered reporting. The platform doesn’t just collect numbers; it helps you interpret them. For example, its analytics can highlight which automated workflows are generating the highest-quality MQLs, or which customer segments are most likely to drive repeat revenue. Because the reporting is tied directly to client interactions, insights feel more actionable and less abstract.
For marketers, this translates into faster optimization cycles. If open rates drop, you can quickly see whether it’s tied to subject line performance, timing, or even the type of customer segment targeted. If retention starts slipping, the system flags patterns in customer conversations that might explain why.
Turn KPIS into qualified leads
Marketing automation KPIs aren’t just numbers on a dashboard; they’re the compass that keeps campaigns aligned with business goals. By tracking the right mix of customer, engagement, conversion, and value metrics, marketers can see which strategies truly drive growth.
With the right tools in place and a commitment to continuous optimization, those insights turn into action: lower acquisition costs, stronger retention, and campaigns that deliver measurable revenue.
Text App makes this process even easier by bringing all your KPIs from live chat, email, and AI-driven conversations into one dashboard. Instead of stitching together fragmented reports, you can measure the full customer journey in a single view.
Stop guessing, start growing. Try Text App today for free and see how unified analytics turn insights into revenue!
FAQ
What are the most important marketing automation KPIs?
Customer acquisition cost (CAC), customer lifetime value (CLV), conversion rates, and ROI are among the most critical KPIs. Together, they show efficiency, profitability, and long-term growth potential.
How often should KPIs be reviewed?
Monthly reviews are common, but weekly checks help teams catch trends early. The key is consistency, tracking at the same intervals to spot meaningful changes.
Why do vanity metrics matter less?
Metrics like followers or email sends show activity but not impact. Without connecting to outcomes like revenue or retention, they don’t prove business growth.
How does Text App support KPI tracking?
Text App unifies analytics across live chat, email, and AI-driven interactions. It ties customer conversations directly to performance metrics, making optimization faster and more effective.
Get a summary with